
Introduction
Ommatissus lybicus de Bergevin (Hemiptera: Tropiduchidae), commonly known as the date palm dubas bug, is a major pest that has a detrimental effect on date fruit production in many countries (Al-Kindi, Kwan, Andrew, and Welch, 2017 ; Khanet al., 2020). The decline in date fruit yields caused by infestations of the date palm Dubas bug is a significant concern for farmers in the Middle East and North Africa (Al Shidi, Kumar, Al-Khatri, Albahri, and Alaufi, 2018). Pests like the Dubas bug can cause an economic loss of up to 28% in date fruit production. The insect feeds on the nutrient-rich sap of palm trees, damaging palm trees (Shahet al., 2016). The consumption of palm sap by nymphs and adult insects results in the formation of honeydew on the leaf surface (Al-Khatri, 2004; Howard, 2001). Over time, dust accumulates on the honeydew, fostering the growth of black sooty mold on the leaves, which can impede the photosynthesis process of the date palm (Neteler, Roiz, Rocchini, Castellani, and Rizzoli, 2011; Shahet al., 2012). This pest disrupts the plant's vital functions, weakens the tree, and leads to poor fruit quality and considerable financial losses. Prolonged and severe infestations can also result in the deterioration and eventual destruction of the palm tree (Carpenter and Elmer, 1978). This damage can be minimized if the Dubas bug is controlled.
Before addressing this pest issue, it is of utmost importance to accurately identify and pinpoint the location of the pest. Once this step is completed, farmers can implement various control measures and pest management techniques. A prevalent approach within this field involves the use of chemical insecticides, which can be applied through ground-based or aerial spraying methods (Al-Khatri, 2011). Identifying and localizing infestations through visual field inspection by farmers can be quite a challenge. This is mainly because the symptoms of the infestation can vary greatly depending on the tree species and the initial location of the infestation. Existing detection methods often prove ineffective when applied to large areas, as each tree must be examined individually (Wakil, Faleiro, and Miller, 2015). Human eye-based field inspections of extensive agricultural areas are limited by their high cost, complexity, time, and lack of precision (Pontius, Schaberg, and Hanavan, 2020; Samuel Adelabu, Mutanga, and Cho, 2012). Remote sensing has emerged as a critical tool for monitoring the health and condition of date palm plantations, offering a cost-effective and scalable alternative to traditional field inspections. Advances in this field have made this technology a promising option for detecting and mapping pests. Pests can cause considerable damage to plants, which manifests itself in a number of visible signs and symptoms. These signs can include a reduction in leaf size, loss of color, and changes in the overall layout of the plant canopy. These changes to the health and appearance of the plant can be attributed to the effects of the pests on the wavelengths of light reflected in the visible and near-infrared ranges (Silva, Olthoff, de la Mata, and Alonso, 2013).
The ability of remote sensing to detect changes in soil and vegetation provides valuable information for the implementation of site-specific management practices (Hicke and Logan, 2009; Weiss, Jacob, and Duveiller, 2020). Hicke and Logan (2009) have shown that by using multispectral Quickbird satellite imagery with a spatial resolution of 2.4 m in conjunction with the maximum likelihood classification method, a map can be created depicting the mortality in whitebark pine caused by the mountain pine beetle outbreak. Oumar and Mutanga (2013) developed a model using Worldview-2 satellite data to assess its ability to predict the impact of the bronze beetle (Thaumastocoris peregrinus) on plantation forests. The monitoring model successfully predicted the extent of damage caused by the bronze beetle. It achieved a coefficient of determination of 65% and a root mean square error of 3.62 when tested with independent experimental data sets. In this investigation, the WorldView-2 sensor's red-edge and near-infrared bands, along with specific pigment indices and red-edge indices, were found to play a critical role in accurately predicting damage. The characteristic leaf symptoms of Blumeria graminis, also known as surface powdery mildew, can be identified through the use of remote sensing technology. Zhanget al. (2014) attempted to create a distribution map of powdery mildew of winter wheat at the regional level using medium-resolution satellite images (CCD sensor on the Huanjing satellite) using time series. The result of this study was an overall accuracy of 78%. Yuan, Pu, Zhang, Wang, and Yang (2016) also investigated the use of high-resolution (6 m) multispectral SPOT-6 satellite imagery to monitor the powdery mildew of winter wheat in an area of high disease incidence. They identified five key spectral features sensitive to the problem and developed a system to identify powdery mildew using the spectral angle mapping method. Validation with field data showed that the system achieved an accuracy of 78% and a kappa coefficient of 0.55.
Using hyperspectral data, S. Adelabu, Mutanga, Adam, and Sebego (2014) conducted a study on the degree of forest canopy cover change due to insect defoliation. The classification accuracy of the model created using the random forest algorithm was found to be 82.42%. The leaf loss in plants caused by the eucalyptus weevil (Gonipterus scutellatus) showed a strong relationship with the vegetation indices (VIs) calculated from the red edge bands of the WorldView-2 satellite images (Lottering and Mutanga, 2016). A study Haghighian, Yousefi, and Keesstra (2022) investigated the performance of Sentinel-2 imagery in detecting oaks infested by T. viridana in the Zagros forest habitat. VIs were derived from T. viridana infested and non-infested areas. The results of this study revealed significant differences in VIs between infested and non-infested zones within the study site, with a confidence level of 99%. Al Shidi, Kumar, and Al-Khatri (2019) conducted a study on the detection of date palm Dubas bug infestation by analyzing the changes in reflectance at different degrees of infestation. They used high-resolution multispectral images from the WorldView-3 satellite to capture images of infested areas. The researchers identified 32 vegetation indicators and found that reflectance in the red and near-infrared edge bands decreased with higher infestation levels. They also observed significant differences in the red edge, NIR1, and NIR2 spectral bands in high-infested areas compared to uninfested, low-infested, and medium-infested areas.
While accessibility and affordability have been challenges, the Sentinel-2 A + B satellites from the European Space Agency have addressed these issues by offering free enhanced resolution and frequent revisits to monitor fields effectively. The spectral resolution of the data captures a wide range of bands crucial for assessing vegetation health, making it a valuable tool in various agricultural applications (Segarra, Buchaillot, Araus, and Kefauver, 2020). The timely identification of date palm infestation with the Dubas bug can be greatly supported by analyzing multispectral satellite images. This method offers a significant advantage in controlling the spread of the infestation. However, there is a notable absence of documented cases where researchers have used the readily available and free multispectral data from the Sentinel-2 satellite to detect date palm infestations. Every year, more than 200,000 tonnes of dates are harvested from groves in the eastern province of Kerman, Iran, and Dubas bugs infest between 2,000 and 3,000 hectares of these groves in the northern part of this province. The findings of Rostami, Assari, Pejman, and Shaker (2019) indicate that the majority of palm groves surveyed for Dubas bug pest density in Bam, Kerman Province, Iran, showed moderate to high levels of damage. In particular, over 69% of the orchards had moderate, high, or very high infestation densities. Consequently, more than 69% of the groves in the region require urgent intervention. Due to the significant presence of the Dubas bug in the area, the current study focuses on determining the possibility of detecting date Dubas bug infestation in the urban area of Bam by analyzing changes in reflectance at different levels of infestation using multispectral images from the Sentinel-2 satellite.
Materials and Methods
Research site
The palm groves in the urban area in the Iranian province of Kerman were selected as the study area (Fig. 1). The study area is located at approximately 29.00° north latitude and 58.30° east longitude and is characterized by its pronounced desert climate, which falls under the Köppen climate classification. This climate is characterized by very hot summers, during which temperatures can rise considerably, and mild winters, starkly contrasting to the summer months' heat. In addition, the region has low annual rainfall, which further determines the region's environmental conditions and affects the growth and survival of palm trees in urban groves. The first generation of Dubas bug in urban groves typically first appears in April.

Fig. 1. An aerial photo captured with a UAV of date fruit plantations in the urban area of Bam
The pest infestation peak occurs during the most nourishing period of the insect's life cycle, precisely in May, when the nymph is in its third and fourth stages of growth (Mahmoudi, Gheybi, and Khoshnoud, 2020). Therefore, field and satellite measurements from the research site were conducted in May. The date palms in the urban area of Bam were divided into grids. Within each grid, a focal point was designated for collecting information, conducting training, and evaluating the classification model.
Field inspection
A grid-based survey covering the 480.22 km2 urban area of Bam (divided into 48 individual 1 km2 grids) was conducted to map the spatial distribution and intensity of Dubas bug infestations following a seasonal regular pest outbreak. Tree density varied across grids due to the heterogeneous urban landscape of Bam, including houses, roads, and open spaces, with trees spaced approximately 8×8 meters apart. Within each grid, the degree of infestation was determined using the average measurements of three randomly selected trees with a minimum distance of 20 meters to ensure an adjustment to the resolution of the Sentinel-2 images. This methodology enabled a comprehensive assessment of infestation patterns across the urban environment. As recommended by (Hussain, 1963), pest density was documented during the field measurements by categorizing the infestation at each point into three levels: low (with an average of 0-5 eggs per leaflet), medium (5-10 eggs per leaflet), and high (more than 10 eggs per leaflet). Fig. 2 showcases an inspected example of date palm leaflets infested with the Dubas bug pest.

Fig. 2. An instance of the inspected leaflets from a date palm tree infested with the Dubas bug
The GPS device (GARMIN eTrex Summit) was used to record the geographical coordinates of the sampling points with an accuracy of three meters. In May 2023, the research site underwent field visits, sampling, and the acquisition of satellite images concurrently. The time of sampling was chosen as close as possible to the time at which the satellite flew over the study area. The provided Fig. 3 displays the specific locations where inspections were conducted to gather data on infestation in the urban area of Bam.

Fig. 3. The locations in the Bam urban area were inspected for information on infestation
Sensing information and selected bands
The Sentinel-2 satellite captures multispectral imagery across 13 bands in the visible and infrared ranges, providing high-resolution data for vegetation analysis (Table 1). The benefits of this satellite include free public information, resolutions of 10, 20, and 60 meters, a wide field of view of 290 km, and global coverage. The spatial resolution for the RGB and infrared bands is 10 meters (EOS, 2018). For this particular study, eleven bands were selected for modeling, with bands 1 and 10 excluded due to their sensitivity to aerosols and clouds as well as their lower spatial resolution. These bands are not suitable for mapping vegetation (Kumbula, Mafongoya, Peerbhay, Lottering, and Ismail, 2019).
| Band number | Spatial resolution (meters) | Bandwidth (nm) | Characteristic |
|---|---|---|---|
| 1 | 60 | 453-433 | Coastal aerosol |
| 2 | 10 | 523-458 | Blue |
| 3 | 10 | 578-543 | Green |
| 4 | 10 | 680-650 | Red |
| 5 | 20 | 713-698 | Red Edge |
| 6 | 20 | 748-734 | Red Edge |
| 7 | 20 | 785-765 | Red Edge |
| 8 | 10 | 900-785 | Near Infrared (NIR) |
| 8A | 20 | 875-855 | Narrow NIR |
| 9 | 60 | 950-930 | Water vapour |
| 10 | 60 | 1385-1365 | Short Wave Infrared (SWIR) – Cirrus |
| 11 | 20 | 1655-1565 | SWIR |
| 12 | 20 | 2280-2100 | SWIR |
Downloading satellite data
With a review period of 5 days, the Sentinel-2 satellite is suitable for detecting pest infestations in a timely manner. The sensor's image covers a large area with a width of 290 km (Segarraet al., 2020). The large size of the image poses a challenge in capturing and pre-processing the image. In this study, using the USGS website (https://earthexplorer.usgs.gov), the images of the Sentinel-2 satellite were divided into smaller sections prior to processing. Among the images reviewed in the specified time period, the image received from the region on May 8, 2023, with the Sentinel-2 sensor, had the lowest cloud cover (0.056). Therefore, this image was selected for further processing (Fig. 4).

Fig. 4. Sentinel-2 image, May 8, 2023
Data preprocessing and modeling a classifier
The SNAP software platform, developed by the European Space Agency (ESA) for Sentinel mission support, was utilized for image processing, modeling, and data visualization. With the application of the SNAP software, the Fast Line-of-sight Atmospheric Analysis of Spectral Hypercubes (FLAASH) method was employed for atmospheric correction of the acquired images. The ground references were validated by including specific points such as buildings, roads, and other relevant elements. The Nearest Neighbor interpolation method was used when resampling satellite images to standardize all bands to a uniform 10-meter resolution. This technique assigns values to each "corrected" pixel based on the proximity of the nearest "uncorrected" pixel. The Nearest Neighbor method is recognized for its ease of implementation and its ability to maintain the original values within the unaltered scene. In particular, it transfers the digital number (DN) of the nearest input pixel to the corresponding output pixel determined by its spatial coordinates.
Plant stress is evident through the presence of honeydew and dust deposits on the leaves, which cause the green color of the leaf to turn yellow over time. Vegetation indices (VIs) are used to analyze and explore vegetation in spectral satellite imagery, which requires mathematical conversions of specific wavelength bands. Previous studies have highlighted vegetation indicators associated with this color change (Mirik, Michels, Kassymzhanova-Mirik, and Elliott, 2007; Reisig and Godfrey, 2006; Saadikhani, Maharlooei, Rostami, and Edalat, 2023). In this study, the Normalized Difference Vegetation Index (NDVI) and Normalized Difference Moisture Index (NDMI) indicators were first analyzed to evaluate the effectiveness of the Sentinel-2 satellite spectral bands in detecting vegetation and stress caused by Dobas insect infestations (Table 2).
| Index | Equation | Reference |
|---|---|---|
| NDVI | (NIR- Red)/(NIR+ Red) | (Rouse, Haas, Schell, and Deering, 1974) |
| NDMI | (NIR1- NIR2)/(NIR1+ NIR2) | (Bernstein, Jin, Gregor, and Adler-Golden, 2012) |
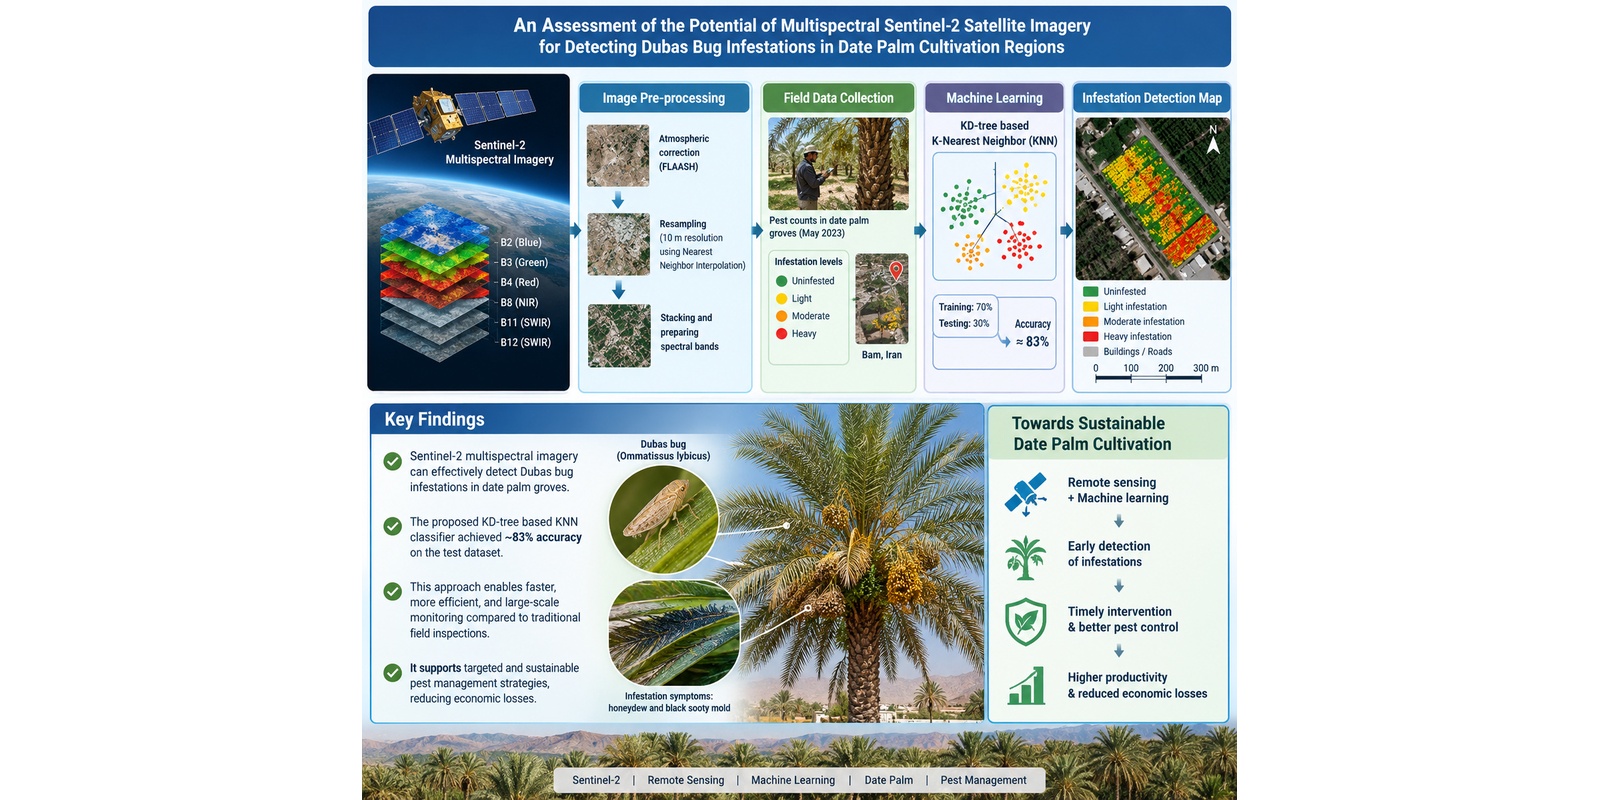
In addition to NDVI and NDMI, a number of remote sensing indices are available for analyzing Sentinel-2 satellite images (IDB, 2024). To overcome the challenge of selecting an appropriate vegetation index for detecting vegetation stress due to Dubas bug infestation, one can use principal component analysis (PCA) to leverage the full spectral data of a satellite image. PCA, a statistical technique, simplifies the dimensions of the dataset to create an index for each specific location. By incorporating all spectral information from the satellite image, PCA can effectively highlight vegetation stress and pest infestations. This method enables comprehensive data analysis by taking into account all the captured bands. Reducing the data set through PCA helps identify hidden patterns and relationships that may not be apparent with a single vegetation index. After acquiring the multispectral images and performing a principal component analysis, a classification model based on the K-nearest neighbor using the KD-tree is created. The model takes into account data obtained from field measurements of date palm groves. Seventy percent of the field survey data from each degree of infestation (uninfested, low-infested, medium-infested, and high-infested areas) and other land features such as buildings, roads, etc., were used to train the model, while the remaining thirty percent was used for evaluation. Once the model is trained, its accuracy is assessed by comparing its predictions with the data obtained from field measurements. In this way, it is possible to assess how well the model can identify and classify the different infestation levels.
Evaluation metrics of the classification model
The confusion matrix provides a detailed evaluation of how well the model's predictions align with the actual class labels. It allows for the evaluation of a classification model's accuracy by comparing its results to a predetermined set of test data with known true values (Kulkarni, Chong, and Batarseh, 2020). It provides valuable insights, including True Positive (TP), for accurate predictions of positive cases, such as the correct diagnosis of a pest infestation. False Positive (FP) occurs when negative cases are mistakenly predicted as positive, for example, when a pest infestation is inaccurately diagnosed (Type I error). False Negative (FN) points out instances where positive cases are inaccurately predicted as negative, such as when a pest infestation is overlooked even though it is present (Type II error). Finally, True Negative (TN) signifies correct predictions of negative cases, e.g., when the absence of an infestation is correctly detected (Tiwari, 2022). These results could contribute significantly to understanding the performance of the model in scenarios related to infestation diagnosis.
The metrics of accuracy (Eq. 1) and precision (Eq. 2) were also considered to assess the validity of the classification. Accuracy refers to the overall correctness of the classification results, indicating how well the model identified and categorized different data points. Although accuracy is important for evaluating the results, it may not be reliable in cases of significant class imbalance, as it can be misleading. In such situations, alternative metrics such as precision should be considered. Due to the partial imbalance in the spatial infestation data, the precision metric was also considered. Precision measures the proportion of correctly predicted positive instances out of all instances predicted as positive, helping to assess the model's ability to identify true positive instances and avoid false positive instances. Analyzing these metrics together with the elements of the confusion matrix enables a more detailed evaluation of the performance of the classification model. This comprehensive approach provides a clearer understanding of the model's strengths and weaknesses.
Results and Discussion
Data analysis
Fig. 5 shows the map of the NDVI for the urban area of Bam, a simple and efficient method for quantifying vegetation. This index serves as an indicator of vegetation health and is determined by the reflection of light from plants at specific wavelengths ranging from -1 to 1. Negative NDVI values (close to -1) indicate the presence of water, while values close to zero (-0.1 to 0.1) typically indicate barren areas such as rocks or sand. Low to moderately positive values (around 0.2 to 0.4) are associated with shrubs and grasslands, while high values are associated with trees and, in the context of Bam, with palm groves.

Fig. 5. Map of the Normalized Difference Vegetation Index estimated in the urban area of Bam
The NDMI is used to assess the water content of plants and to monitor drought conditions, with a scale ranging from -1 to 1. Negative NDMI values (close to -1) usually indicate poor soils, while values close to zero (-0.2 to 0.4) are generally associated with water stress. On the other hand, high positive values indicate lush vegetation cover without water stress (around 0.4 to 1). This normalized index of moisture difference can also serve as an indicator of vegetation stress in the studied area. The normalized index map illustrating the estimated moisture difference for the urban area of Bam is shown in Fig. 6. It shows the effective differentiation of vegetation from other land features such as buildings, roads, and open land.

Fig. 6. The Normalized Difference Moisture Index map of the estimated humidity difference for the urban area of Bam
Fig. 5 and Fig. 6 show the suitability of NDVI and NDMI for date palm detection and the likely ability to diagnose the dubas bus. However, in the field of vegetation analysis, other indices such as Green Chlorophyll Index-Green (CI-G), Green Difference Vegetation Index (GDVI), Green Normalized Difference Vegetation Index (GNDVI), Green Ratio Vegetation Index (GRVI), Normalized Red (NR), and Simple Ratio (SR) have also attracted interest. Atmospheric conditions, background noise, and sensor variations limit the indices. A study in Oman focused on the detection of palm Dubas bug invasions using WorldView-3 satellite imagery, which led to alternative indices being considered (Al Shidiet al., 2019).
One technique is to use tasseled cap indices to assess changes in green, yellow, and lightness by merging data from different bands (Baig, Lifu, Tong, and Tong, 2014). The tasseled cap transformation converts the original image bands into a new set of bands with specific meanings that are useful for vegetation mapping. This process involves the formation of "linear combinations" of the original image bands, a concept similar to PCA (Kauth and Thomas, 1976; Peerbhay, Ilaria, Romano, and Naicker, 2022). Rather than calculating numerous vegetation indices, this study utilizes PCA analysis of all spectral bands of satellite imagery to identify key variables associated with Dubas bug pest infestation, soil composition, water bodies, and various land cover attributes. By using PCA, we can effectively reduce the dimensionality of the data while retaining essential information about plant health. This approach allows us to identify patterns and relationships in the data that may not be as obvious when analyzing vegetation indices separately. In addition, PCA analysis provides a comprehensive overview of all available spectral information, enabling a more holistic assessment of plant health. This method can help identify subtle variations and correlations between different spectral bands, leading to a more accurate and nuanced understanding of plant conditions.
Classification results
The K-nearest neighbor classification model was first trained and developed to distinguish date trees from other land features such as buildings, roads, and soil. They were then used to identify areas of pest infestation and categorize the degree of infestation into three levels: low, medium, and high. As mentioned above, 70% of the labeled samples were assigned for training, while the remaining 30% were used for evaluation.
In the first step of building the model, field measurements were collected and categorized into two classes: 0 and 1. Class 0 represents features that are not date palms, such as buildings, roads, and land, while class 1 represents date palms. The results show that the K-nearest neighbor classification model using the KD-tree was able to effectively identify the unique features of date palms and distinguish them from other land features (Table 3). The calculated Root Mean Squared Error (RMSE) of 0.1311 indicates the average variance between the values predicted by the model and the actual values and shows the ability of the model to accurately predict the target value. In addition, the KD Tree KNN Classifier showed 98.28 percent correct predictions when evaluating the test dataset, demonstrating its effectiveness in discriminating date palms.
| Classification metrics | Class 1: date tree | Class 0: other |
|---|---|---|
| Accuracy | 0.9828 | 0.9828 |
| Precision | 0.9801 | 0.9855 |
| Correlation | 0.9662 | 0.9662 |
| Error Rate | 0.0172 | 0.0172 |
| True Positives | 2464 | 2450 |
| False Positives | 50 | 36 |
| True Negatives | 2450 | 2464 |
| False Negatives | 36 | 50 |
In addition, classification models were developed to identify infestation by categorizing the field measurement data into four classes based on the degree of tree infestation: uninfested, light-infested, moderate-infested, and heavy-infested. Other land factors were assigned to a separate category. After training and evaluation of the classification algorithms, the KD-tree-based K-nearest neighbor classifier again showed the best performance in detecting the presence and severity of infestation at the date palm sites. The classifier uses a KD-tree, a data structure that organizes the training data for an efficient nearest neighbor search. To evaluate the accuracy of the classification, the classification value for each measurement point was extracted, and corresponding evaluation metrics were created. These metrics are calculated by conducting a pixel-by-pixel comparison between the training samples in the ground truth and the corresponding pixels in the classification results.
Table 4 provides an overview of the classification assessment for different levels of infestation of the date palm Dubas bug. The precision metric, which indicates the accuracy of the classification model, was calculated for each category. A precision value of 0.98 for the detection of other land features shows that the model is very accurate in identifying these pixels. For date palm locations without infestation, the precision score is 0.67, which means that the model correctly identifies 67% of these pixels. This suggests that uninfested areas may be misclassified as Dubas bug infestations. Also, for low, medium, and high infestations, the precision values are 0.74, 0.77, and 0.66, respectively, indicating varying degrees of accuracy in identifying the severity of Dubas bug infestation. These metrics suggest that the model performs relatively well in identifying low and medium infestations but is less accurate in identifying severe infestations.
| Classification metrices | Class 0: other | Class 1: level_0 | Class 2: level_1 | Class 3: level_2 | Class 4: level_3 |
|---|---|---|---|---|---|
| Accuracy | 0.9951 | 0.9586 | 0.9140 | 0.9093 | 0.8920 |
| Precision | 0.9970 | 0.6667 | 0.7450 | 0.7709 | 0.6649 |
| Correlation | 0.9899 | 0.4131 | 0.7583 | 0.7146 | 0.6771 |
| Error Rate | 0.0049 | 0.0414 | 0.0860 | 0.0907 | 0.1080 |
| True Positives | 1982 | 60 | 789 | 636 | 629 |
| False Positives | 6 | 30 | 270 | 189 | 317 |
| True Negatives | 2902 | 4645 | 3697 | 3827 | 3749 |
| False Negatives | 18 | 173 | 152 | 256 | 213 |
The KD classifier achieved an accuracy of 83%, correctly predicting the infestation category for 83% of the test dataset. Furthermore, the root mean square error (RMSE) for the classifier's predictions is 0.7693. The RMSE is a measure of the average difference between the predicted and actual values, with lower values indicating better accuracy. In this case, the RMSE indicates that the classifier's predictions are relatively close to the actual values. Overall, the scoring metric performs well in accurately categorizing Dubas bug infestations, with some room for improvement in distinguishing between infested and non-infested areas.
Fig. 7 illustrates the predicted distribution of Dubas bug infestations in the urban area of Bam, as derived from multispectral satellite imagery. On Monday, May 8, 2023, the areas with high infestation are highlighted in red. Through the utilization of multispectral satellite data and machine learning-based classification, a method for detecting Dubas bug infestation in date palms using remote sensing was successfully developed and evaluated with high validity and accuracy.

Fig. 7. Prediction of the pixels infected with the palm weevil pest in Bam city
Conclusion
This research signifies a substantial advancement in the management of palm dubas within the Bam urban region through the integration of Sentinel-2 multispectral data with conventional pest management techniques. This combination of technological innovation and established practices has the capacity to improve the safeguarding of date palms against this harmful pest. The suggested remote sensing methodology presents a cost-efficient and accessible approach, functioning as a practical resource for farmers and agricultural managers. A key benefit of this strategy lies in its capacity for the early identification of Dubas bug infestations, in addition to the continuous observation of pest populations and their distribution throughout date palm groves. Early identification and continuous monitoring are essential as they empower stakeholders to enact timely responses to potential outbreaks. By averting extensive infestations, this proposed method could significantly diminish fruit damage, leading to increased yields and enhanced date quality. As a result, the livelihoods of farmers and communities reliant on date palm agriculture could be bolstered. Subsequent research initiatives should emphasize leveraging the capabilities of convolutional neural networks (CNNs) to enhance the precision of Dubas bug detection. Greater detection accuracy will facilitate more effective and focused interventions, ultimately optimizing pest management strategies. However, the expansion of this innovative approach to broader geographic regions or varying environmental conditions necessitates a meticulous and comprehensive evaluation of numerous factors. These factors encompass discrepancies in climate, topography, and the distinctive attributes of date palm cultivation across different areas.
Conflict of Interest: The authors declare no competing interests.
Author Contributions
H. Karimi: Conceptualization, Data pre and post processing, Writing- Original draft, Statistical analysis and Software services
M. J. Assari: Technical advice, Methodology and Data acquisition
H. Zohdi: Conceptualization and Supervision
F. Ranjbar-Varandi: Technical advice, Review and editing services
References
- Adelabu, S., Mutanga, O., Adam, E., and Sebego, R. (2014). Spectral Discrimination of Insect Defoliation Levels in Mopane Woodland Using Hyperspectral Data. IEEE Journal of Selected Topics in Applied Earth Observations and Remote Sensing, 7(1), 177-186.DOI
- Adelabu, S., Mutanga, O., and Cho, M. A. (2012). A review of remote sensing of insect defoliation and its implications for the detection and mapping of Imbrasia belina defoliation of Mopane Woodland. The African Journal of Plant Science and Biotechnology, 6.
- Al-Khatri, S. (2004). Date palm pests and their control. In Proceedings of the Date Palm Regional Workshop on Ecosystem-Based IPM for Date Palm in Gulf Countries (pp. 84-88). Al Ain, UAE.
- Al-Khatri, S. A. H. (2011). Biological, ecological and phylogenic studies of Pseudoligosita babylonica Viggiani, a native egg parasitoid of Dubas bug Ommatissus lybicus de Bergevin, the major pest of date palm in the Sultanate of Oman (Ph.D. thesis). University of Reading, Reading, UK.
- Al-Kindi, K. M., Kwan, P., Andrew, N., and Welch, M. (2017). Impact of environmental variables on Dubas bug infestation rate: A case study from the Sultanate of Oman. PloS one, 12(5), e0178109.DOI
- Al Shidi, R. H., Kumar, L., and Al-Khatri, S. A. (2019). Detecting Dubas bug infestations using high resolution multispectral satellite data in Oman. Computers and Electronics in Agriculture, 157, 1-11.DOI
- Al Shidi, R. H., Kumar, L., Al-Khatri, S. A., Albahri, M. M., and Alaufi, M. S. (2018). Relationship of date palm tree density to Dubas bug Ommatissus lybicus infestation in Omani orchards. Agriculture, 8(5), 64.DOI
- Baig, M. H. A., Lifu, Z., Tong, S., and Tong, Q. (2014). Derivation of a tasselled cap transformation based on Landsat 8 at-satellite reflectance. Remote Sensing Letters, 5(5), 423-431.DOI
- Bernstein, L. S., Jin, X., Gregor, B., and Adler-Golden, S. M. (2012). Quick atmospheric correction code: algorithm description and recent upgrades. Optical engineering, 51(11), 111719.DOI
- Carpenter, J. B., and Elmer, H. S. (1978). Pests and diseases of the date palm (USDA Agriculture Handbook No. 527). Washington, DC: U.S. Department of Agriculture. Retrieved from https://www.govinfo.gov/content/pkg/GOVPUB-A-PURL-gpo29615/pdf/GOVPUB-A-PURL-gpo29615.pdf.
- EOS. (2018). Sentinel-2 imagery. Earth Observing System. Retrieved from https://eos.com/sentinel-2/.
- Haghighian, F., Yousefi, S., and Keesstra, S. (2022). Identifying tree health using sentinel-2 images: a case study on Tortrix viridana L. infected oak trees in Western Iran. Geocarto International, 37(1), 304-314.DOI
- Hicke, J. A., and Logan, J. (2009). Mapping whitebark pine mortality caused by a mountain pine beetle outbreak with high spatial resolution satellite imagery. International Journal of Remote Sensing, 30(17), 4427-4441.DOI
- Howard, F. (2001). Insect pests of palms and their control. Pesticide outlook, 12(6), 240-243.DOI
- Hussain, A. A. (1963). Biology and control of the dubas bug, Ommatissus binotatus lybicus de Berg. (Homoptera, Tropiduchidae), infesting date palms in Iraq. Bulletin of Entomological Research, 53(4), 737-745.DOI
- IDB. (2024). Sentinel-2 RS indices. Retrieved from https://custom-scripts.sentinel-hub.com/custom-scripts/sentinel-2/indexdb/.
- Kauth, R. J., and Thomas, G. (1976). The tasselled cap — A graphic description of the spectral-temporal development of agricultural crops as seen by Landsat. In Proceedings of the LARS Symposium on Machine Processing of Remotely Sensed Data (pp. 41–51). West Lafayette, IN: Purdue University.
- Khan, A. L., Asaf, S., Khan, A., Khan, A., Imran, M., Al-Harrasi, A., ..., and Al-Rawahi, A. (2020). Transcriptomic analysis of Dubas bug (Ommatissus lybicus Bergevin) infestation to Date Palm. Scientific Reports, 10(1), 1-15.DOI
- Kulkarni, A., Chong, D., and Batarseh, F. A. (2020). 5 - Foundations of data imbalance and solutions for a data democracy. In F. A. Batarseh and R. Yang (Eds.), Data Democracy (pp. 83-106): Academic Press.DOI
- Kumbula, S. T., Mafongoya, P., Peerbhay, K. Y., Lottering, R. T., and Ismail, R. (2019). Using Sentinel-2 Multispectral Images to Map the Occurrence of the Cossid Moth (Coryphodema tristis) in Eucalyptus Nitens Plantations of Mpumalanga, South Africa. Remote Sensing, 11(3), 278.DOI
- Lottering, R., and Mutanga, O. (2016). Optimising the spatial resolution of WorldView-2 pan-sharpened imagery for predicting levels of Gonipterus scutellatus defoliation in KwaZulu-Natal, South Africa. ISPRS Journal of Photogrammetry and Remote Sensing, 112, 13-22.DOI
- Mahmoudi, M., Gheybi, M., and Khoshnoud, M. (2020). A study on different sampling techniques for dubas bug, Ommatissus lybicus (Hem.: Tropiduchidae). Plant Pest Research, 10(3).DOI
- Mirik, M., Michels, G. J., Kassymzhanova-Mirik, S., and Elliott, N. C. (2007). Reflectance characteristics of Russian wheat aphid (Hemiptera: Aphididae) stress and abundance in winter wheat. Computers and Electronics in Agriculture, 57(2), 123-134.DOI
- Neteler, M., Roiz, D., Rocchini, D., Castellani, C., and Rizzoli, A. (2011). Terra and Aqua satellites track tiger mosquito invasion: modelling the potential distribution of Aedes albopictus in north-eastern Italy. International Journal of Health Geographics, 10(1), 1-14.DOI
- Oumar, Z., and Mutanga, O. (2013). Using WorldView-2 bands and indices to predict bronze bug (Thaumastocoris peregrinus) damage in plantation forests. International Journal of Remote Sensing, 34(6), 2236-2249.DOI
- Peerbhay, K., Ilaria, G., Romano, L., and Naicker, R. (2022). Remote sensing wattle rust induced defoliation across black wattle timber plantations in Southern Africa. International Journal of Remote Sensing, 43(6), 2212-2226.DOI
- Pontius, J., Schaberg, P., and Hanavan, R. (2020). Remote Sensing for Early, Detailed, and Accurate Detection of Forest Disturbance and Decline for Protection of Biodiversity. In J. Cavender-Bares, J. A. Gamon, and P. A. Townsend (Eds.), Remote Sensing of Plant Biodiversity (pp. 121-154). Cham: Springer International Publishing.DOI
- Reisig, D., and Godfrey, L. (2006). Remote Sensing for Detection of Cotton Aphid– (Homoptera: Aphididae) and Spider Mite– (Acari: Tetranychidae) Infested Cotton in the San Joaquin Valley. Environmental Entomology, 35(6), 1635-1646.DOI
- Rostami, M. A., Assari, M. J., Pejman, A., and Shaker, M. (2019). Preparation of distribution and severity map for Dubas bug (Ommatissus lybicus) in Bam region by Geographic Information System. Plant Pests Research, 9(1), 63-73.DOI
- Rouse, J., Haas, J., Schell, J., and Deering, D. (1974). Monitoring vegetation systems in the Great Plains with ERTS. In Proceedings of the Third ERTS 1 Symposium (NASA SP 351, Vol. 1, pp. 309–317). Washington, DC: NASA. Retrieved from https://ntrs.nasa.gov/archive/nasa/casi.ntrs.nasa.gov/19740022614.pdf.
- Saadikhani, M., Maharlooei, M., Rostami, M. A., and Edalat, M. (2023). Fusion of Multispectral and Radar Images to Enhance Classification Accuracy and Estimate the Area under Various Crops Cultivation. Journal of Agricultural Machinery, 13(4), 493-508.DOI
- Segarra, J., Buchaillot, M. L., Araus, J. L., and Kefauver, S. C. (2020). Remote Sensing for Precision Agriculture: Sentinel-2 Improved Features and Applications. Agronomy, 10(5).DOI
- Shah, Ata ul Mohsin, M., Naeem, M., Nasir, M. F., Irfan ul Haq, M., and Hafeez, Z. (2012). Biology of Dubas Bug, Ommatissus lybicus (Homoptera: Tropiduchidae), a pest on date palm during spring and summer seasons in Panjgur, Pakistan. Pakistan Journal of Zoology, 44(6), 1603-1611.
- Shah, A., Zia, A., Rafi, M. A., Mehmood, S. A., Aslam, S., and Chaudhry, M. T. (2016). Quantification of honeydew production caused by dubas bug on three date palm cultivars. Journal of Entomology and Zoology Studies, 4(4), 478-484.
- Silva, C. R., Olthoff, A., de la Mata, J. A. D., and Alonso, A. P. (2013). Remote monitoring of forest insect defoliation. A review. Forest Systems, 22(3), 377-391.DOI
- Tiwari, A. (2022). Chapter 2- Supervised learning: From theory to applications. In R. Pandey, S. K. Khatri, N. k. Singh, and P. Verma (Eds.), Artificial Intelligence and Machine Learning for EDGE Computing (pp. 23-32): Academic Press.DOI
- Wakil, W., Faleiro, J. R., and Miller, T. A. (2015). Sustainable pest management in date palm: current status and emerging challenges: Springer.DOI
- Weiss, M., Jacob, F., and Duveiller, G. (2020). Remote sensing for agricultural applications: A meta-review. Remote Sensing of Environment, 236, 111402.DOI
- Yuan, L., Pu, R., Zhang, J., Wang, J., and Yang, H. (2016). Using high spatial resolution satellite imagery for mapping powdery mildew at a regional scale. Precision Agriculture, 17(3), 332-348.DOI
- Zhang, J., Pu, R., Yuan, L., Wang, J., Huang, W., and Yang, G. (2014). Monitoring powdery mildew of winter wheat by using moderate resolution multi-temporal satellite imagery. PloS one, 9(4), e93107.DOI


